Table of Contents
Post-Processing
There are now a vast array of tools are available for examining data from simulations. More recently due to the development of predictive capabilities for codes, the requirements for post-processing are evolving to derive parameters that are akin to experimental measurements for direct comparison, such are called 'synthetic diagnostics'. We have developed a range of these under contract to ITER, and are described below.
Intro to post processing
Excellent intro to post-processing by Joseph A. Insley, Principle Software Development Specialist at Argonne National Lab ( Argonne Leadership Computing Facility)
- Post-processing using a scripting language (like Matlab, Octave or IDL)
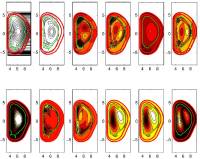
e.g. ITER simulation post-processing with MATLAB:
- Post-processing using visualization tools
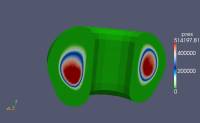
e.g. ITER simulation post-processing with Paraview:
Scripting Languages
Scripted processing of the data files provides a number of direct benefits: 1) Matlab/Octave scripting is familiar to most, so it offers wide and easy access to the data; 2) synthetic diagnostics can be programmed straightforwardly, either directly from solution fields (for B, V, T and n) or by taking derivatives (for J, for example, or for flux); 3) scripting allows for automation of the post-processing which then saves time for future iterations of the same data (for example, we have a script that will run to produce movies of datasets).
Tarball of Matlab routines to obtain data from NIMROD dump files (acknowledge Richard Milroy at the University of Washington)
Tarball of Matlab routines also runs with Octave (which is opensource).
Running an octave script
Invoke Octave with:
octave
to load the script, just type filename into the octave commandline:
octave:1> example
for a file named example.m
Visualization Packages - Manuals/Tutorials
GUI-based visualization tools are very powerful for graphically manupulating large datasets without needing to script. Usually the GUI will allow also for some scripting, however the main utility is to quickly display a large dataset, consisting of solution fields without any futher manipulation of the data. As such this is less useful for direct comparison with experimental data which may consist of a 2d plot of one parameter at one location as a function of time, which may or may not be the solution field (e.g. B or T), but could be a derived quantity (e.g. J).
The main tools we use are: VISIT and ParaView. Although there are many other tools, each requires some time to get used to, and since both VISIT and ParaView are free, and supported extensively by LLNL and LANL, these are our first choices.
2016 Bootcamp: Sections
- 1
1.11.2- 1.3
2- 2.1
- 2.2
- 2.3
- 2.4 note especially Clip - submenus, not so much
2.5- 2.6 perhaps come back to if there's time
2.7- 2.8 just the first paragraph and accompanying pictures
- 2.9 we actually don't change the color scale very often
- 2.10 optional
- 2.11 can skip to exercise 2.25 if time is getting short
2.122.13
Common Data Formats
Primarily the data formats that we use are VTK, and we convert for example, NIMROD dump files using a python script to VTK format using a routine written by Brian Nelson at the University of Washington.
Synthetic Diagnostics
In fusion devices, there are a range of standard diagnostics (please take a look at the diagnostics that we can build here. To build a synthetic diagnostic, usually one has to have the real diagnostic in mind, then if it is a point measurement, the location can be specified (same for chordal measurements, and plane-measurements).
Magnetics
B-dot coils (B), rogowskis (I, J),
Electrostatics
Langmuir probes (V, v, T), Retarding Grid Energy Analysers (T)
Refractive index
Interferometers (<nL>), polarimeters (<BL>)
Scattering
Thomson (T®, n®)
Radiation
Bolometers (P_rad), spectrometers (P_rad), scintillators, IR cameras (Surface P_rad)
Making movies
First convert the .eps files to .jpg files (if you are using the matlab scripts) using ImageMagick
$convert *.eps image_%03d.jpg
Make movies use mencoder:
$mencoder mf://*.jpg -ovc lavc -lavcopts vcodec=mpeg4:mbd=2:trell -oac copy -o output.avi
View movies use VLC (best done locally i.e. not on control - scp the output.avi file from your control account to your terminal):
$vlc output.avi
To transfer files to your local terminal do:
$scp -P 26 username@10.1.10.11:directory/file.avi .


